Tracing a Java Application with OpenTel-Collector, Jaeger and Dynatrace.
Introduction
In modern observability stacks, OpenTelemetry (OTel) plays a key role in instrumenting applications and exporting trace data to backends like Jaeger, Tempo, or Dynatrace. With Jaeger v2 natively supporting OTLP, it's now easier than ever to collect, route, and visualize traces in a standardized format.
In this guide, you’ll learn how to instrument a Java JAR or WAR application using the OpenTelemetry Java Agent, send traces to the OpenTelemetry Collector, and view them in Jaeger, Tempo, or Dynatrace.
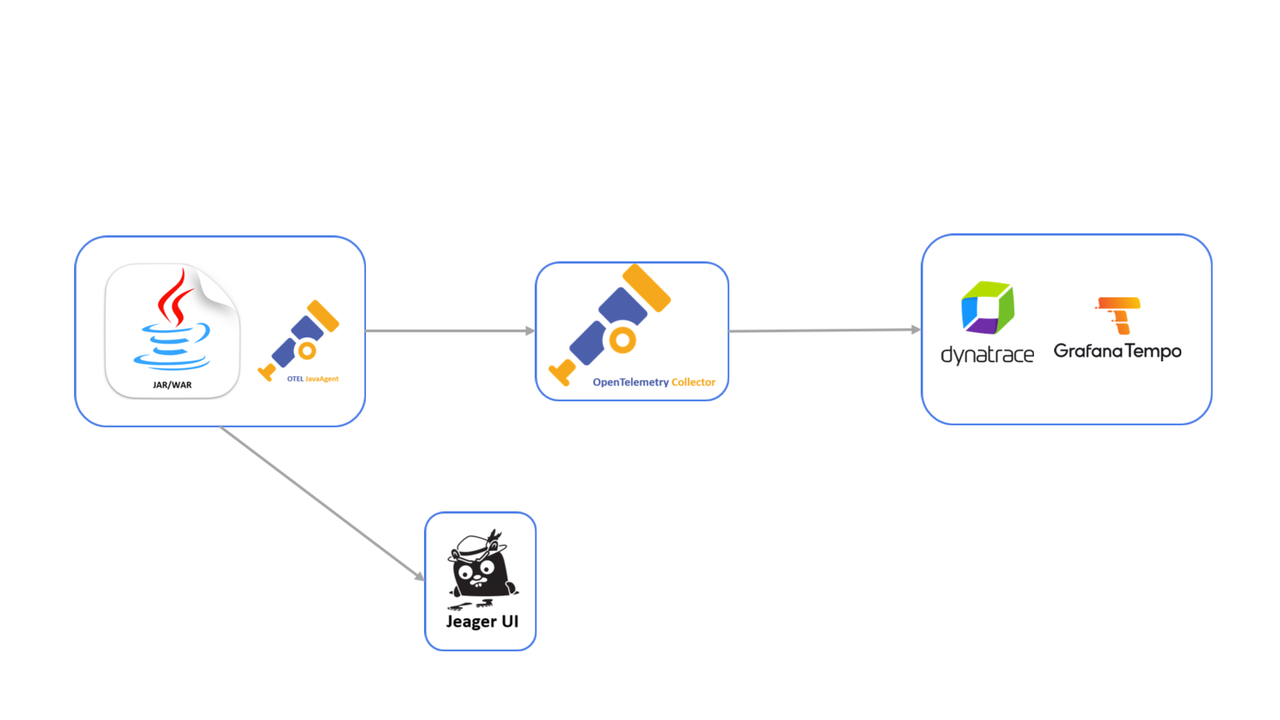
Architecture
This is how the full system looks:
Prerequisites
- Java 8+ installed
- Your Java application (.jar or .war)
- Jaeger v2
- OpenTelemetry Java Agent
- OpenTelemetry Collector
- Dynatrace Access Token and Environment URL (if integrating with Dynatrace)
Step 1: Run Jaeger
i) Extract the Jaeger binary
tar -xzvf jaeger-*.tar.gzcd jaeger-*
ii) Start Jaeger in the background
nohup ./jaeger-all-in-one &This will expose the Jaeger UI at http://localhost:16686
Step 2: Start the Java Application
For JAR:
Start the App using below
nohup java -javaagent:/path/to/opentelemetry-javaagent.jar
  -Dotel.service.name=bookstore
  -Dotel.exporter.otlp.endpoint=http://localhost:4317
  -Dotel.exporter.otlp.protocol=grpc
  -jar /path/to/yourapp.jar &
For WAR (Tomcat example):
Navigate to Tomcat's bin directory:
cd $HOME/tomcat/binCreate the setenv.sh script:
touch setenv.shEdit the file:
vi setenv.shAdd the following lines to setenv.sh:
export CATALINA_OPTS="$CATALINA_OPTS -javaagent:/path/to/opentelemetry-javaagent.jar"
export OTEL_EXPORTER_OTLP_ENDPOINT=http://localhost:4318
export OTEL_EXPORTER_OTLP_TRACES_PROTOCOL=http
export OTEL_EXPORTER_OTLP_METRICS_PROTOCOL=http
export OTEL_EXPORTER_OTLP_LOGS_PROTOCOL=http
export OTEL_RESOURCE_ATTRIBUTES=service.name=test
Note: Replace /path/to/opentelemetry-javaagent.jar with the actual full path to your agent file.
Make the script executable:
chmod +x setenv.shStart Tomcat:
./startup.shView your traces in Jaeger UI
Step 3: Configure Opentelemetry Collector
To send traces to Dynatrace, Tempo, etc.
Create a Collector Configuration File (e.g., otel-config.yaml):
receivers:
  otlp:
    protocols:
      grpc:
        endpoint: 0.0.0.0:4317
      http:
        endpoint: 0.0.0.0:4318

processors:
  batch:

exporters:
  otlphttp:
    endpoint: "https://{your-environment-id}.live.dynatrace.com/api/v2/otlp"
    headers:
      Authorization: "Api-Token {your-dynatrace-api-token}"

service:
  pipelines:
    traces:
      receivers: [otlp]
      processors: [batch]
      exporters: [debug, otlphttp]
    metrics:
      receivers: [otlp]
      processors: [batch]
      exporters: [otlphttp]
    logs:
      receivers: [otlp]
      processors: [batch]
      exporters: [otlphttp]
Replace:
{your-environment-id}with your Dynatrace tenant (e.g.,abc12345){your-dynatrace-api-token}with your actual API token
Start the OpenTelemetry Collector:
otelcol --config otel-config.yamlResult: Your Java app sends telemetry via the agent → OpenTelemetry Collector → Dynatrace.
Join the conversation